Master IELTS Writing Task 1 Pie Chart Vocabulary for Band 9
Last updated: Dec 30, 2025According to reports from the Indian Times, the number of IELTS aspirants has surged by 15% since the pandemic, as a strong score on this exam is essential for achieving their dreams. However, many test-takers find it challenging to excel, particularly when it comes to describing pie charts in Writing Task 1. A solid pie chart vocabulary is crucial for success in this section.
You may be wondering what this vocabulary entails. In this blog, we will explore effective strategies and expert tips to help you confidently tackle pie charts.

Table of Contents
Introduction to Pie Chart Vocabulary for IELTS
Any student who wants to go overseas and build their career needs to clear the International English Language Testing System. Since it has a crucial purpose, clearing it isn’t that easy. There are four main segments of the exam—reading, writing, speaking, and listening—where students find the need to seek help in multiple parts. One such is the PIE chart Vocabulary.
If you are someone preparing for this test, then you’re at the right place. In this blog, you’ll get a better understanding of the topic- Vocabulary words for IELTS. So, let’s get a quick insight into it without much delay. However, before you jump into that, you need to know the basics. So, let’s start with it.
When you appear for this test, there is a segment in the “Writing part” - Pie chart. This is where many students face trouble because this is a question to describe the given chart and write an answer in 150 words but in the right manner. Here, the answer must be short, precise, and include the right vocabulary for pie chart. Wondering what it can be? Here are the top 30 words you need to know!
Also read: IELTS Writing Task 1: Charts, Samples, Tips & More
Top Pie Chart Vocabulary Words
If, by any chance, you are not aware and are looking for vocabulary words for IELTS, here is a complete set to give you a better idea of it:
| A Large Portion | To denote a significant part of the chart |
| A Small Portion | To denote a minor part of the chart |
| Account For | To explain the reason for a segment’s size |
| Compare | To denote the analysis of similarities or differences between segments |
| Comprise | To denote what makes up a segment |
| Constitute | To denote what makes up a part just like comprise |
| Contrast | To highlight differences between segments |
| Disproportionate | To denote uneven distribution in the chart |
| Decrease | To denote a downward trend |
| Dominant | To denote the most prominent part |
| Equal Distribution | To denote segments with the same sizes |
| Fluctuate | To denote variation over time |
| Fraction | To denote a part of the total in fractions |
| Half | To denote 50% of the total |
| Increase | To denote an upward trend |
| Majority | To denote the largest segment |
| Marginally | To denote a slight change |
| Minority | To denote the smallest segment |
| Peak | To denote the highest point in a chart |
| Percentage | To denote a part from the whole in % |
| Plummet | To denote a dramatic decrease |
| Proportion | To denote the size of a part in relation to the whole |
| Quarter | To denote 25% of the pie chart |
| Segment | To denote a part or division of the pie chart |
| Significantly | To denote a notable change |
| Slice | To denote a part or division, just like a segment |
| Soar | To denote a dramatic increase |
| To denote no change in the trend | |
| Third | To denote 33% of the total |
| Trivial | To denote a minor important part |
Now, let’s take an insight into the usage of the above-listed terminology when describing a question. So, here, you can get an insight into how to blend these terms in writing task 1 pie chart.
 Take Writing Mock Test Now!
Percentage to Fractions or Ratios
| Percentage | Fractions |
|---|---|
| 5% | One in Twenty |
| 10% | One in ten |
| 15% | Less than a fifth |
| 20% | A fifth |
| 25% | A quarter |
| 30% | Less than a third |
| 35% | More than a third |
| 40% | Two fifths |
| 45% | More than two-fifths |
| 50% | Half |
| 55% | More than half |
| 60% | Three fifths |
| 65% | Two thirds |
| 70% | Seven in ten |
| 75% | Three- quarters |
| 80% | Four-fifths |
Percentage to Qualifiers
| 32% | Almost a third |
| 49% | Nearly a half/ just under a half |
| 77% | Approximately three quarters/ just over three quarters |
Percentage to Other Phrases
| 5% | A very small number |
| 10%-15% | A minority |
| 65%-75% | A significant proportion |
| 75%-85% | A very large majority |
Steps to Structure Your Answer for Pie Chart
If you are about to attempt this exam and want to know how to deal with IELTS pie chart vocabulary, here is a simple step-by-step guide. You can follow this to draft a well-structured answer:
Understand the Requirement
The very first thing to do while using the PIE chart vocabulary is to understand the requirements. You need to study the chart and investigate what it is about. This includes examining the main idea of the chart and what it represents through the diagram.
Focus on Right Pointers
The next step is to note all important points. So, after understanding the question, you must keep an eye on the key points in the chart, like what are the major and minor segments, and what percentages are given?
Prepare an Outline
The next step is to prepare an outline. The ideal way to put your answer for the writing task 1 pie chart is as follows:
- Introduction to explain the chart in a liner
- The first paragraph covers the main pointers
- Second paragraph to add supporting pointers
- Conclusion to summarise the idea of the chart
Draft the Content
The next step in this process is to draft the actual content. Based on the outline above, you’ve got to answer the question using the right pie chart vocabulary for IELTS. Here, you focus on covering the major pointers and categories of the chart and including the main idea.
Edit and Proofread the Answer
The final step of this process is to take a minute to re-read the answer. Here, you must check all the key pointers are well-mentioned. Then, check the values and categories. Finally, the summary must be aligned. Now, proofread it for any mistakes and rectify them accordingly.
These are some simple steps you must follow when you are planning to attempt IELTS pie chart vocabulary based questions. Now, let’s take a quick look at a few samples to understand this better.
IELTS Pie Chart Sample Question
The best way to understand this is through an IELTS writing mock test. So, here are a few samples to help you get a better idea of how to learn and revise this.
Sample 1
Question:
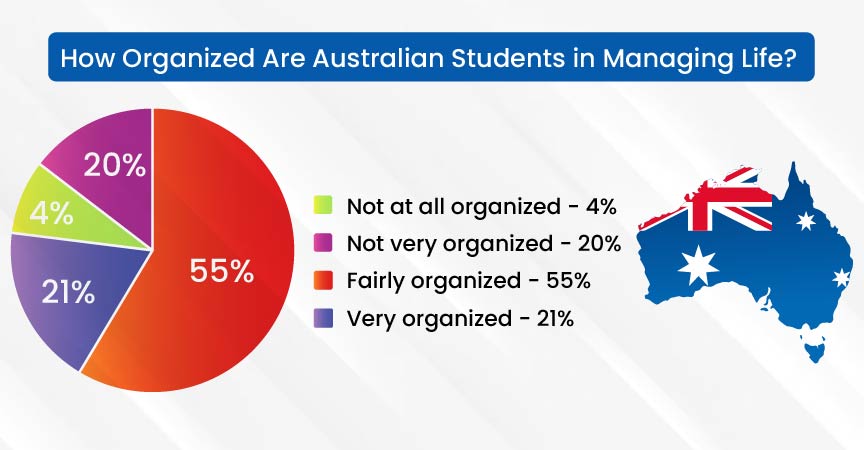
The diagram shows Australian students' answers to the question, "How well do they call themselves organized when it comes to living alone, studying, and working part-time?"
Summarise the information by selecting and reporting the main features and make comparisons where relevant.
Pie Chart:
Answer:
The above pie chart shows the percentage of Australian students who are organized or not while living alone, studying, and working part-time. In the given data, you can see that only 21% of students in the total are very organized and hold the second position. Fairly organized students hold the first position, with more than half of 55 percent. In the chart, you can also see that 20% of Australian students are not very organized, and only 4% of students are not at all organized.
This is the PIE Chart Vocabulary every student must use. However, let's understand this better by using another example.
Sample 2
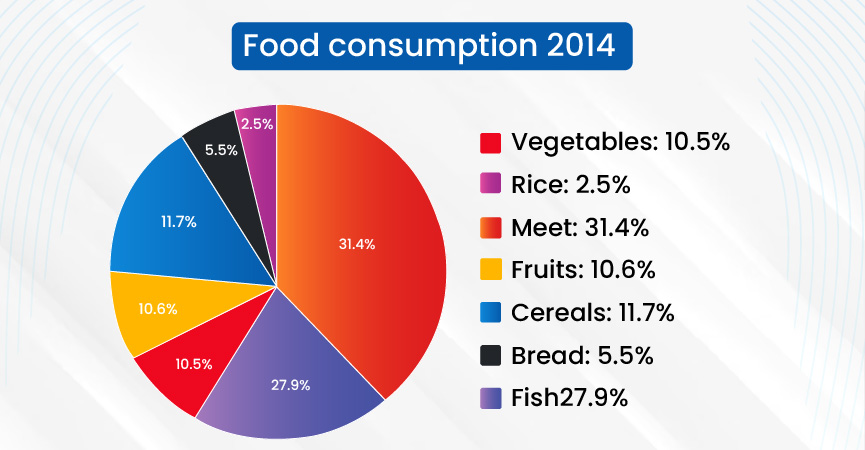
This pie chart shows the shares of total world food consumption held by each of the seven different food types in the year 2014.
Answer:
The pie chart provides a detailed breakdown of global food consumption across seven different food categories in 2014. The largest share is attributed to meat, which makes up 31.4% of the total consumption, highlighting its position as the most preferred food type during this period. Following closely behind is fish, accounting for 27.9% of global consumption, indicating a strong preference for seafood worldwide.
Cereals take the third spot, making up 11.7% of the total, showcasing their significance in global diets. Fruits and vegetables hold similar shares, with fruits slightly leading at 10.6% and vegetables just behind at 10.5%. These figures underline the role of fresh produce in the world's food consumption patterns, though they fall far behind meat and fish.
Bread constitutes 5.5% of total consumption, making it a less dominant but still notable part of the global diet. Lastly, rice holds the smallest portion of the pie, with just 2.5% of the total, indicating that, despite its importance in some regions, it was the least consumed food category on a global scale in 2014.
This distribution underscores a significant inclination towards protein-rich food sources like meat and fish, while grains like bread and rice had comparatively lower shares in global consumption during this year.
Now that you have checked out the samples, you can appear for IELTS mock test and practice for better band scores. However, if you need more assistance, you can always turn to Gradding for the best online IELTS coaching and complete guidance to score the top bands. Now, let's check out a few tips from the experts on how to prepare for the pie chart vocabulary for IELTS.

Tips for Using Pie Chart Vocabulary
Students planning to appear for this exam know it is not easy. However, with the right guidance, one can easily make sure to get the best band score. As there is nothing like a specific IELTS syllabus, students must focus on using the right language and vocabulary. Thus, students should improve their PIE chart vocabulary and increase their chances of scoring better grades. Now, let’s check out some tips on how to use them:
- Read the pie chart question carefully
- Avoid personal opinions
- Use right vocabulary
- Focus on the headings
- Study the data on the chart well
- Concentrate on time frames
- Compare the data in the chart
- Stick to the word count
- Introduce the main idea first
- Organize data into categories
Now that you’ve checked out the tips on how to get the pie chart vocabulary band 9 score, you get a detailed idea about this topic. However, if you get stuck or need any assistance, you can always turn to Gradding. Our experts will always help you fulfil your dream of scoring the best grades on IELTS.
Also read: IELTS Pie Chart Task 1 - Samples and Tips for Success
Conclusion
No doubt, solving the pie chart questions in the IELTS exam is a challenging task because it is a bit hard to understand the data and then elaborate on using a good vocabulary. So, test takers must practice by solving mock test papers. It will help them to enhance their vocabulary for pie chart. Moreover, they must also join online ing for the best practice. Trainers there will help them to improve their PIE Chart Vocabulary with several practices and even guide them with the best steps and tips to solve it. Hence, this will ultimately affect the preparation, and aspirants will be able to solve the writing section more efficiently.
FAQ’s
Q.1 What is Pie Chart Vocabulary?
These are the specific words and phrases used to describe the pie chart after analyzing it well.
Q.2 How to calculate pie chart percentage?
There are 2 ways to conclude the Pie chart.
First, to calculate the percentage, divide the given data by the total data and multiply it by 100. If you have to convert the data into degrees, divide the given data by the total data and multiply it by 360.
Q.3 How to conclude a pie chart?
To conclude the Pie chart in the IELTS, always remember to focus on the main idea. You should highlight the highest and lowest proportion of the given data.
Q.4 How to compare two pie charts?
When you have to compare 2 pie charts, first gather all the given information. Then
- Identify and list the measured variables.
- Compare each variable.
- At last, describe and differentiate the similarities.
Q.5 How to write a pie chart in IELTS task 1?
To write the pie chart in IELTS task 1, first divide the given information into two groups. Now, focus on the highest and lowest data given to simplify it. Finally, you can use phrases and synonyms to describe it.
0 comments

Practice Makes a Man Perfect!Take FREE ielts Mock Tests
Start FREE Mock Test


Predict your IELTS Band

98% students got exact IELTS Band
What is your Target IELTS Band?


Get familiar with the Real IELTS Exam for Free!
Start Free Mock TestWe are available in :
BangaloreAhmedabadJaipurHyderabadKeralaPuneChandigarhMumbaiGurgaonChennaiKolkataTrivandrumNoidaKochiCalicutKottayamKollamThrissurIndoreUdaipurdisclaimer:logos and other registered trademarks of universities used on this platform are held by their respective owners. Gradding does not claim ownership or association on them, and their use is purely for informational and illustrative purposes.