IELTS Academic Task 1 Bar Graph Topics 2026
Last updated: Dec 30, 2025To excel in the IELTS Bar Chart Task 1, it’s essential to understand how to effectively analyze and describe data. In this guide, we’ll explore what a bar chart is, its significance in the IELTS exam, and how to craft a strong response. You’ll also find valuable tips and sample questions with answers to help you master this task. By the end, you’ll be well-equipped to improve your writing skills and confidently tackle the bar chart IELTS task. Let’s get started on how to enhance your performance in this important section of the test.

Table of Contents
An Insight into the Bar Graph Task 1 in IELTS
A bar chart or bar graph is a common task in the IELTS academic writing test. Every student applying for this exam must appear for bar graph task 1, which plays a crucial role in the band scores. In this blog, you can learn all about it and tips that can improve the quality of the output. But, before understanding it, let’s learn a bit about this graph.
A bar graph is named for its two axes: the X-axis (horizontal) and the Y-axis (vertical). Each axis represents a different category. The equation of both axes is represented in a graphical way using bars in either horizontal or vertical axes based on the available data related to the study. There are a few more types like a line graph, map task 1, and a pie chart task 1that are also commonly used in IELTS exam patterns.
However, in this blog, we will only focus on the study of the writing task 1 Bar Graph. It is used to understand the interpretation of an applicant based on the graph. So, let’s get started!
 Take Writing Mock Test Now!
How to Write a Bar Chart Task? | The Right Structure
If you are planning to appear for this exam, you need to understand the Task 1 bar graph better. This chart is used to test an applicant's interpretation and presentation skills. It means the data should be concise, correct, and clear. The candidate must draft the write-up only based on the available data and not predict or assume information that is not clearly mentioned in the graph. Most importantly, the presentation should be done in the right format as described in the IELTS syllabus. So, let's take a quick look at the right structure to follow when appearing for this bar graph for the IELTS task:
Introduction
The very first segment of this task is the Introduction. It should emphasise the categories or lists mentioned in the question and also add any missing information. The introduction could be perceived as a paraphrased question with added details on the topic. Thus, the introduction of the bar chart task 1 can be of 1 or 2 sentences. You should use good vocabulary and brackets to include lists of 5 or fewer. If the list is longer, you can skip it. Moreover, units used for measurement should be mentioned to add specificness to the content.
Overview
The next section in the Bar graph IELTS task is the overview. It is considered the most important section, and it contributes significantly to the band's score. Thus, one should only highlight key features in this section. Since it is an overview section, you can use words like "Overall, In General, Similarly, etc." Moreover, the key features can be the high and low points of the graph and the top-performing categories of the bar graph IELTS task 1 chart.
Body Paragraph
There are 2 main categories in a body paragraph - A and B. It is suggested to write at least 2 paragraphs in the bar chart IELTS task to gain better attention. If you are wondering how to categorise these paragraphs, then here are 2 suggestions-
- Paragraph A represents the most and least points in the chart, and Paragraph B covers the remaining points in the bar chart IELT.S
- Paragraph A represents the category with the highest points, ts and paragraph B represents the category with the lowest points as per the chart in the IELTS writing task 1 of the exam.
This is the simple structure for answering any question related to a bar graph or chart in the IELTS task 1 of the exam. Now, let's understand more about this topic from the following samples on writing task 2 topics for the IELTS writing test.

Samples of IELTS Bar Graph Task 1
Here, you will get some samples of bar graph IELTS for your practice purposes. Thus, analyse them thoroughly and improve your answers for this task.
Sample 1
In this sample, the given question, along with the graphical representation of the data for the IELTS bar graph Task 1, is as mentioned below:
Question: The diagram below shows the main reasons why employees prefer to work from home in the year 2023. Summarise the information by selecting and reporting the main features and making comparisons where relevant.

Answer
This graph represents the 5 different reasons (Save Time, Save Money, Manage Childcare, Improve Productivity, and Improve Work-life balance) that men and women choose to work from home in the year 2020. The measured units range from 0 to 100 per cent in a time span of a year.
Overall, female employees feel working from home is more convenient for managing childcare (approx 70%) and saves time (60% approx), as compared to men who feel it saves time (approx 50%) but does not improve their productivity much (approx 20%).
In 2020, men chose to work from home to save time, while women chose to manage childcare with work. In contrast, both of them felt an improvement in their productivity by 20% for men and 30% for women.
In the same year, women employees chose to work from home for reasons such as saving time, saving money, and achieving a better work-life balance, compared to men who primarily chose to save time. This underscores the importance of maintaining a healthy work-life balance in the work-from-home context.
Also read: IELTS Process Chart Task 1
Sample 2
Here is another sample related to Task 1 Bar Graph to give you an idea of the IELTS writing exam question.
Question: This chart represents the percentage of freelance writers working in each city in India.
Summarise the information by selecting and reporting the main features and making comparisons where relevant.

Answer
This chart is a graphical interpretation of the percentage of freelance writers working in different cities of India (Kolkata, Mumbai, Chennai, Hyderabad, and Bangalore) in the years 1990 and 2010, respectively. The measured unit is the percentage of the study and the number of writers in both the given time periods.
The data reveals significant shifts in the number of freelance writers across different cities in India. Bangalore saw a substantial increase in the number of freelance writers in 2010, rising to approximately 50% From 30% In 1990. Conversely, Kolkata experienced a decline, dropping to approximately 40% in 2010 from 50% in 1990. Chennai, however, maintained a consistent count of approximately 10% in both time periods.
So, the number of freelance writers working in the 1990 time period was the highest in Kolkata and the lowest in Chennai and Hyderabad. On the other hand, the number of them working in the 2010 time period is the highest in Bangalore and the lowest in Chennai.
From 1990 to 2010, the number of freelance writers working in Mumbai, Hyderabad, and Bangalore rose, while Chennai remained the same, and the count declined in Kolkata.
Sample 3
Let’s now take a look at another example of the writing task 1 bar graph of the IELTS exam here, along with a graphical representation of the data.
Question: This Bar Graph task 1 chart shows the percentage of usage of different social media apps during the day and night.
Summarise the information by selecting and reporting the main features and making comparisons where relevant.

Answer
This is a graphical interpretation of the percentage of users of social media apps like WhatsApp, Snapchat, Instagram, LinkedIn, and MetaX during the day and night. The used metrics for measurement are percentage and the variables are day and night.
It's fascinating to note that social media app usage shifts significantly from day to night, with more people engaging in the digital world after dark. The most popular apps during these times are Instagram, WhatsApp, and Snapchat, adding an interesting layer to our understanding of user behaviour.
The Instagram app is the most used social media app during the night (Approx 90%), and WhatsApp is the most used app during the day (Approx 70%). On the other hand, LinkedIn is the least used app at night (Approx 40%, while Meta X is the least used during the day (Approx 20%)
From this, it is clear that, during that time, Meta X was the least used social media application compared to Instagram, WhatsApp, Snapchat, and LinkedIn. On the other hand, LinkedIn stands as the least used social media app compared to others during the night.
Sample 4
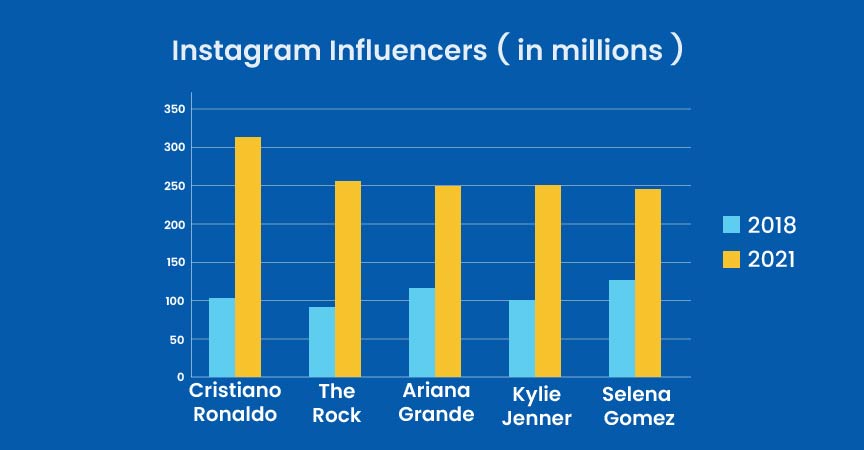
The bar chart below shows the popularity of well-known Instagram accounts in 2018 and 2021. Summarise the information by selecting and reporting the main features, and make comparisons where relevant.
Answer
The bar chart shown above mentions the details of the followers of the 5 most popular personalities in the years 2018 and 2021. Moreover, the overall result of this graph is that Cristiano Ronaldo became the most followed personality and Selena Gomez became the least followed personality from the most followed in the given span of years.
In 2018, Selena Gomez was the most followed personality with around 125 million followers. Ariana Grande was second with 112 million followers, and Ronaldowast third with around 110 million followers. In 2021, followers of Selena almost doubled to around 245 million followers, while Ronaldo crossed all the celebrities and got 315 million followers. Moreover, Ariana has more than double the followers with over 250 million followers.
The two final personalities, Kylie Jenner and The Rock, also saw a boost in theirfollowers’s number. Both of them had below 100 million followers in 2018 and got around 250 million followers in 2021. So, both of them saw a rise of around 150 million in their old number.
Sample 5
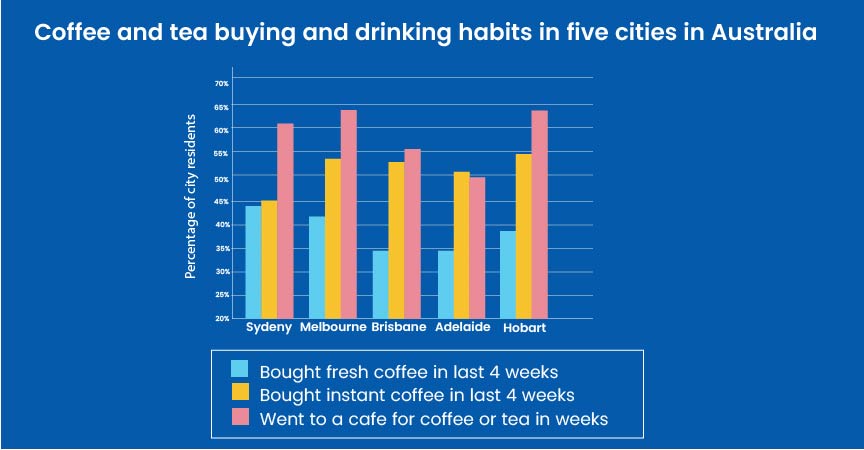
The chart below shows the results of a survey about people’s coffee and tea buying and drinking habits in five Australian cities.
Summarise the information by selecting and reporting the main features, and make comparisons where relevant.
Answer
The chart shows the details of the drinking habits of 5 cities in Australia. Overall, more than half of the population in all cities except Adelaide went to a cafe for coffee or tea, while buying instant coffee was also popular, and buying fresh coffee was generally less common.
Looking first of all at going to cafes, it was highest in Melbourne and Hobart at 64% and 63%, respectively. Sydney was comparably high at just over 60%, followed by Brisbane at over 55%, and finally Adelaide at under 50%. Adelaide was the only city where people bought more instant coffee by a slight margin (50%). In Hobart, instant coffee purchases stood at 54%, ahead of Brisbane at 52%, Melbourne at 48%, and lastly Sydney (just over 45%).
Stocking up on fresh coffee was below 45% for all cities. It was most common in Sydney (44%) and Melbourne (42%). Hobart was next at 39%, and Adelaide and Brisbane were much lower and nearly level at around 34%.
Expert Tips to Write a Bar Graph Task 1 Answer in IELTS
If you are not sure how to begin withthe bar graph task 1 or need some extra assistance to get started with it, then this is for you. Here are some professional tips dropped by our experts to help you overcome hesitation and achieve success. So, let’s check them out!
- Write around 150 Words
- Highlight Key Features
- Describe Important Highlights
- Use Adverbs and Adjectives
- Focus on Differences and Similarities
- Paraphrase the Question in the Introduction
- Use Stats in Overview and Body Paragraphs
- Add Precise Data When Possible
- Focus on Changes and Trends
- Double-check all Data
These are some tips that applicants must take note of when appearing for Bar Graph Task 1. In case you have more queries or want assistance with IELTS exam preparation, feel free to reach out to us for assistance.
Conclusion
In this blog, you looked into the basics of a bar graph task 1, its role in the IELTS writing task, and how to answer it, along with examples and tips to draft a good one. This write-up, curated by professional experts,s can help you prepare for this question thoroughly so that you can get guaranteed output. Moreover, if you need help preparing for the IELTS exam, you can always count on us for the best aid.

Frequently Asked Questions:
1. How to Attempt Bar Graph Questions in IELTS?
It's very important to study the graph first before you attempt the question. While attempting, take note of all key features and double-check data after writing it.
2. What to Write in a Bar Graph Question?
You can mention all variables and data represented in the graph. Describe the given information with a clear explanation in the answer.
3. What Not to Do When Answering This?
You should not assume, predict, or come up with any reason that is not in the graph. You should not write anything that is not mentioned in the graph with your own evaluation.
4. Can My Band Score Be Impacted with This Question?
Yes, the more precise the overview section, the better the grades you get when you attempt this answer. So, make sure to give a clear, concise, and clear answer from the data in the graph.
5. Is This Question Too Tough?
No, you only need to keep a note of a few pointers, such as the answer must be around 150 words, clear, easy to understand, and only based on the data in the graph. Moreover, the answer should be framed around the right structure.
0 comments

Practice Makes a Man Perfect!Take FREE ielts Mock Tests
Start FREE Mock Test


Predict your IELTS Band

98% students got exact IELTS Band
What is your Target IELTS Band?


Get familiar with the Real IELTS Exam for Free!
Start Free Mock Test